Counting people who use illicit drugs: the case of ice

The validity of media reports about an Australian “ice epidemic” have been strongly debated (ice being the street term for the smokable crystalline form of methamphetamine)1,2-4.
One reason for debate has been the disparity between data from the National Drug Strategy Household Survey (NDSHS), which suggest that the prevalence of methamphetamine use has remained stable at around 2% of Australians aged 14 years or older5, and other indicators which suggest that methamphetamine use has risen sharply6.
Some researchers have argued that NDSHS data show that a stable number of people are using methamphetamine, but are experiencing more harms because they have switched to using purer forms of crystalline methamphetamine from less potent forms of the drug (e.g. speed)7.
There are several lines of evidence that are inconsistent with this interpretation.
First, the NDSHS is a cross-sectional survey which means that the same prevalence estimate for past-year use from one survey to the next does not necessarily reflect the same cohort of people using the drug. Populations of illicit drug users are dynamic, and overall prevalence will be a composite of new users entering the population, users remaining in the population, and users leaving the population by quitting, dying, or failing to report past drug use. Thus a stable prevalence does not preclude an increase in the up-take of methamphetamine use.
Second, under-reporting of methamphetamine use was found in the 2013 survey (compared with 2010) which coincided with increased negative media reports about methamphetamine use. This trend in survey under-reporting was not found for other illicit drugs8. Disclosure of illicit drug use in household surveys is sensitive to stigma, and for this and various other reasons, these surveys tend to under-estimate the prevalence of use of more stigmatised drugs. Thus the apparently stable prevalence of methamphetamine use between 2010 and 2013 could be due to increased under-reporting.
Third, the NDSHS provides indirect evidence of an increase in the incidence, or up-take, of methamphetamine use. In 2013, 34% of current methamphetamine users reported having started use in the past three years, compared to 27% in 20109. Most of these new users reported using crystalline methamphetamine9. The NDSHS data also tell us that there has been an increase in the availability of methamphetamine, with the number of Australians being offered methamphetamine or having an opportunity to use the drug increasing from 3.9% in 2010 to 5.8% in 20135.
The NDSHS data also show an increase in the number of Australians using methamphetamine on a regular basis. Specifically, the percentage of current methamphetamine users who use crystalline methamphetamine rather than other forms of the drug (e.g. powder, pills), doubled between 2010 and 2013, from 22% to 50%. So did the number of these people who reported using the drug weekly or more often (from 9% to 16%)5, with frequent users more likely to use the crystalline form of the drug. So it is fair to say that the use of crystalline methamphetamine (“ice”) has increased significantly in the NDSHS, as has regular use of methamphetamine.
The NDSHS data show the increasing use of crystalline methamphetamine by smoking (from 19% to 41% of current methamphetamine users between 2010 and 2013). Smoking has replaced less harmful non-injecting routes of administration (e.g. swallowing and snorting, which dropped from 70% to 50%). Injecting was less common but stable (11% and 10% in 2010 and 2013 respectively). The increased smoking of crystalline methamphetamine is probably a key factor underpinning the more frequent methamphetamine use seen between 2010 and 2013. Smoking is a very efficient route of administration with high dependence liability10 that is associated with compulsive use patterns, and rates of dependence and other harms like those seen with injecting10-13.
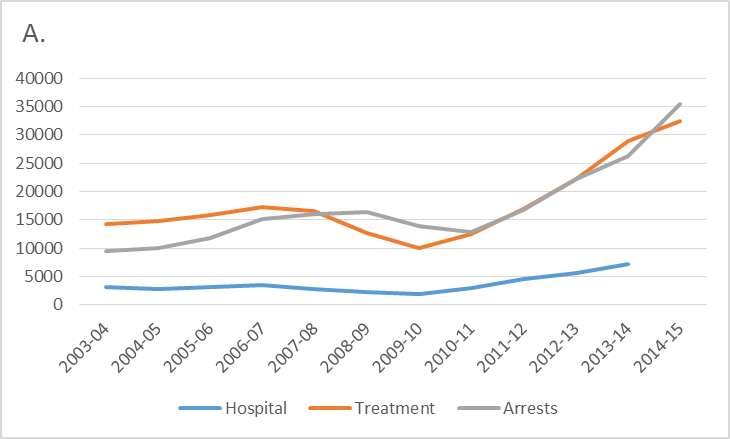
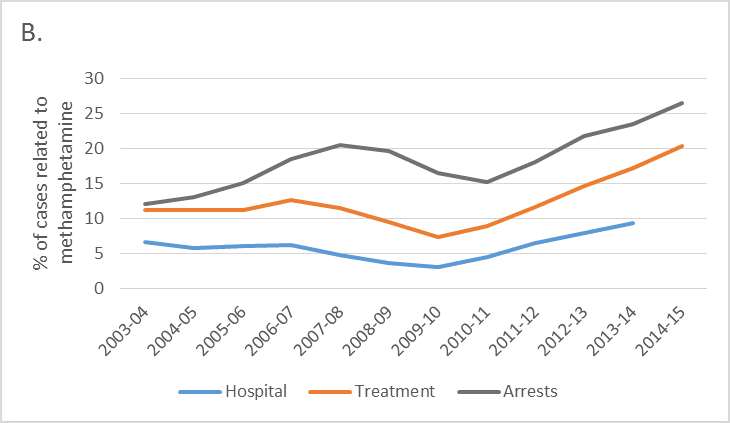
Other data are consistent with increased methamphetamine use. There has been a three to five fold increase in methamphetamine residues detected in Queensland wastewater samples between 2009 and 201514 and in South Australia over a similar period15. Since 2010 there has been a 154% increase in methamphetamine-related arrests, a 274% increase in hospital admissions and a 223% increase in drug treatment demand (Figure 1A)16,17. The latest data are 87-133% higher than an earlier peak in methamphetamine use that occurred in 2006. The increases in these three different indicators (i.e. hospitals, drug treatment centres and arrests) remain when expressed as a proportion of all drug-related events (Figure 1B). This suggests that they are unlikely to reflect changes in data collection or coding, or a shift in resourcing (e.g. more policing or more treatment beds).
The current levels are the highest recorded for methamphetamine-related events in Australian history. They explain why it has been difficult for treatment agencies to meet demand for methamphetamine treatment, and why there has been significant media attention and community concern about methamphetamine, particularly in the form of “ice”. When data are considered carefully, this emergent drug problem is apparent from both the NDSHS data and from other indicators for drug use. The detection and understanding of emerging drug trends requires a thoughtful synthesis of data from various sources rather than relying on a single indicator such as past-year use of a drug in household surveys.


Figure 1. Number (A) and percentage (B) of methamphetamine-related hospital, treatment and arrests, 2003-04 to 2014-15
Note: Hospital data are for ICD codes F15.x, treatment data are all episodes recorded in the Alcohol and Other Drug Treatment Admissions National Minimum Data Set where “amphetamines” were the primary drug of concern (and treatment was provided for the client’s own drug use), and arrests are for illicit drug offences related to amphetamine-type stimulants. Percentages are relative to all drug related events in the relevant year, these being hospital codes F1x.x (Mental and behavioural disorders due to psychoactive substance use), all drug treatment admissions recorded in the Alcohol and Other Drug Treatment Admissions National Minimum Data Set, and all arrests for illicit drug use respectively.
References
- Fitzgerald J. Don’t panic: the ‘ice pandemic’ is a myth. The Sydney Morning Herald. 2015 May 18.
- Adams J. Headline facts vs. Fiction. Media Watch. Episode 33 ed; 2014. p. 15 SEPTEMBER 2014
- Lee NK. Are we in the midst of an ice epidemic? A snapshot of meth use in Australia. 2015. https://theconversation.com/are-we-in-the-midst-of-an-ice-epidemic-a-snapshot-of-meth-use-in-australia-39697 (accessed September 9 2015).
- Quinn B, Dietze P. Awareness campaigns need to target the real victims of ice. 2015. https://theconversation.com/awareness-campaigns-need-to-target-the-real-victims-of-ice-40631.
- Australian Institute of Health and Welfare. National Drug Strategy Household Survey 2013 data & references Supplementary tables 17 July, 2014 2014. http://www.aihw.gov.au/alcohol-and-other-drugs/ndshs/2013/data-and-references/ (accessed August 25, 2014.
- Degenhardt L, Sara G, McKetin R, et al. Crystalline methamphetamine use and methamphetamine-related harms in Australia. . Drug and Alcohol Review In press.
- Scott N, Caulkins JP, Ritter A, Quinn C, Dietze P. High-frequency drug purity and price series as tools for explaining drug trends and harms in Victoria, Australia. Addiction 2015; 110(1): 120-8.
- Chalmers J, Lancaster K, Hughes C. The stigmatisation of ‘ice’ and under-reporting of meth/amphetamine use in general population surveys: A case study from Australia. International Journal of Drug Policy 2016; 36: 15-24.
- Australian Institute of Health and Welfare (AIHW). Trends in methylamphetamine availability, use and treatment: 2003–04 to 2013–14. . Canberra: AIHW; 2015.
- Cho AK. Ice: A New Dosage Form of an Old Drug. Science 1990; 249(4969): 631-4.
- McKetin R, Ross J, Kelly E, et al. Characteristics and harms associated with injecting versus smoking methamphetamine among methamphetamine treatment entrants. Drug and Alcohol Review 2008; 27(3): 277-85.
- McKetin R, Kelly E, McLaren J. The relationship between crystalline methamphetamine use and methamphetamine dependence. Drug and Alcohol Dependence 2006; 85(3): 198-204.
- Matsumoto T, Kamijo A, Miyakawa T, et al. Methamphetamine in Japan: the consequences of methamphetamine abuse as a function of route of administration. Addiction 2002; 97(7): 809-17.
- Lai FY, O'Brien J, Thai PK, Hall WD, Mueller J. Trends in methamphetamine residues in wastewater in metropolitan and regional cities in south-east Queensland, 2009-2015. The Medical journal of Australia 2016; 204(4): 151-2.
- Tscharke BJ, Chen C, Gerber JP, White JM. Trends in stimulant use in Australia: A comparison of wastewater analysis and population surveys. Sci Total Environ 2015; 536: 331-7.
- Australian Institute of Health and Welfare. Alcohol and other drug treatment services in Australia 2014–15 Canberra: Australian Institute of Health and Welfare 2016.
- Australian Institute of Health and Welfare. National Hospital Morbidity Database: Principal diagnosis data cubes for 1993–94 to 2012–13. 2016 ed. http://www.aihw.gov.au/hospitals-data/principal-diagnosis-data-cubes/: Australian Institute of Health and Welfare; 2016.


